
Page 35 - CII ARTHA_Next Generation_Web
P. 35
Global Trends
Some of the other states which have have shown stronger 41.1 per cent in capex respectively in April-February FY24
growth (CAGR) in capital spending in the post-pandemic have witnessed a decline in growth by -4.9 per cent and -14.4 Global Economic
period (FY22-25) compared to pre-pandemic levels (FY15-19), per cent this year. Meanwhile, Karnataka, Maharashtra and
are Maharashtra, Odisha, Rajasthan and Uttar Pradesh. Gujarat continue to push ahead with robust capex spending.
Among the 17 states, Punjab has surprisingly reported the Outlook:
THE CUMULATIVE CAPITAL EXPENDITURE OF highest increase in capex (45.3 per cent) during FY25
STATES HAS SHOWN MODERATION THIS (Apr-February) albeit on a low base; This is followed by
YEAR COMPARED TO THE PREVIOUS YEAR Rajasthan (18 per cent) and Karnataka (15.6 per cent) which
rank second and third respectively. Haryana has recorded the Navigating
highest drop in capex, at -36.6 per cent in April-February FY25
Latest data show that cumulative spending of states fell from followed by West Bengal (-22.8 per cent) and Jharkhand (-17.3
Rs 5.11 lakh crore in April-February FY24 to Rs 4.86 lakh per cent).
crore in April-February FY25. And despite the overall drop in Geopolitical
capex, only 8 of the seventeen states namely Gujarat,
Karnataka, Madhya Pradesh, Maharashtra, Odisha, Uttar UTTAR PRADESH HAS TOPPED THE CHARTS
Pradesh, Telangana and Tamil Nadu have accounted for almost IN TERMS OF QUANTUM OF CAPEX IN
75 per cent of the total capital spend. Hence there is some APR-FEB FY25 Tensions and
concentration in terms of capex among states.
And even within these eight states, which account for a high What is noteworthy is that Uttar Pradesh has topped the Trade Frictions
quantum of capital spending, there has been a degrowth in
capex spending in FY25. For instance, Tamil Nadu have charts in the quantum of capex expenditure by investing Rs
78,842 crore in April-Feb FY25 even though it is less than the
recorded a degrowth in its capex by 4.9 per cent during
April-Feb FY25 as against 2.4 per cent growth in the similar previous year's spending. This indicates a continued
last year period. Similarly, Telangana and Uttar Pradesh, which commitment to infrastructure development and economic
growth within the state. The focus is on infrastructure
experienced a massive capex spending of 147.9 per cent and
development including enhancing freight movement and
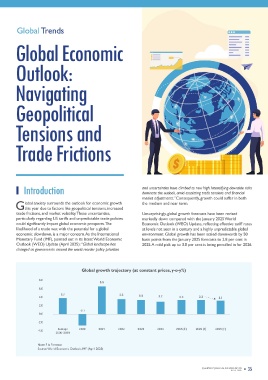
boosting connectivity. This is followed by Madhya Pradesh Introduction and uncertainties have climbed to new high. Intensifying downside risks
which invested Rs 50,795 crore and Maharashtra with Rs dominate the outlook, amid escalating trade tensions and financial
49,216 crore during the year with higher allocation towards market adjustments.” Consequently, growth could suffer in both
G this year due to factors like geopolitical tensions, increased
urban development, irrigation, and transport, among others. lobal anxiety surrounds the outlook for economic growth the medium and near term.
In view of the concern about the decline in state capex during trade frictions, and market volatility. These uncertainties, Unsurprisingly, global growth forecasts have been revised
the year, the government has released nearly Rs 1.5 lakh crore particularly regarding US tariffs and unpredictable trade policies markedly down compared with the January 2025 World
in interest-free capex loans to states for FY25, surpassing the could significantly impact global economic prospects. The Economic Outlook (WEO) Update, reflecting effective tariff rates
revised estimate, with half linked to reforms and project-based likelihood of a trade war, with the potential for a global at levels not seen in a century and a highly unpredictable global
funding. Besides, states facing natural disasters were provided economic slowdown, is a major concern. As the International environment. Global growth has been scaled downwards by 50
with an additional allocation of up to 50 per cent of the Monetary Fund (IMF), pointed out in its latest World Economic basis points from the January 2025 forecasts to 2.8 per cent in
amount already allocated under the untied category. The Outlook (WEO) Update (April 2025): “Global landscape has 2025. A mild pick up to 3.0 per cent is being pencilled in for 2026.
government should continue with the 50-year interest free changed as governments around the world reorder policy priorities
loans scheme for state capex.
It is suggested that provisions may also be made for enhancing
the untied component of capital expenditure loans to states as Global growth trajectory (at constant prices, y-o-y%)
it allows them to allocate funds more flexibly to their specific
needs such as natural disasters and other developmental 8.0
priorities. This contrasts with the tied component, which is 6.6
earmarked for specific projects or reforms. 6.0
3.7 3.6
An analysis of individual states in the post pandemic period, 4.0 3.3 3.2 3.3 3.3 3.1
over the last four years, throws up a few surprises. For A major concern is to address the challenge of capacity
example, Jharkhand experienced the highest cumulative constraints faced by some states to undertake capital 2.0
compound annual growth rate (CAGR) in capital expenditure expenditure to the extent that is required for taking the state 0.0 -2.7
among all states, reaching 36 per cent between FY22 and FY25. forward. The Centre could consider handholding such states or
providing incentives so that the laggard states also join the -2.0
national mainstream when it comes to capital spending.
This growth surpasses the 27 per cent CAGR observed in the Average 2020 2021 2022 2023 2024 2025 (F) 2026 (F) 2029 (F)
state between FY15 and FY19, before the pandemic. No doubt, -4.0 2000-2019
this has come over a low base, but a whopping rise in capex To conclude, states should be encouraged to align their funding
between FY22-24, which somewhat moderated in FY25, shows with capital expenditure to stimulate economic growth, Note: F is Forecast
that Jharkhand has invested significantly in asset creation in the infrastructure development and job creation to drive Source: World Economic Outlook, IMF (April 2025)
post pandemic period. economic expansion in the country
34 QUARTERLY JOURNAL OF ECONOMICS QUARTERLY JOURNAL OF ECONOMICS 35
APRIL 2025
APRIL 2025