
Page 29 - CII ARTHA_Next Generation_Web
P. 29
The broad trends in the six components of the index at the Centre are elucidated in Table 2. The debt index, which includes guarantees, decreased in consolidation plan, with the debt-GDP ratio serving as
2020-21 but subsequently increased and reached its peak in the fiscal anchor starting from 2026-27, the Central
2024-25. The latter is indicative of an improvement in debt Government debt is projected to decline, achieving a debt
Table 2: Composite Index of Budget Quality and Indices of Components (Centre) to GDP ratio. The Central Government Debt to GDP ratio to GDP level of approximately 50±1 per cent by March
stood at 57.1 in 2024-25. According to the fiscal 31, 2031
Quality Indices of Individual Components Fiscal
Year Performance
Net tax Revenue Capital Fiscal Revenue Debt Index
receipts expenditure expenditure deficit deficit
2005-06 27.5 32.2 5.9 78.5 76.9 31.6 42.1
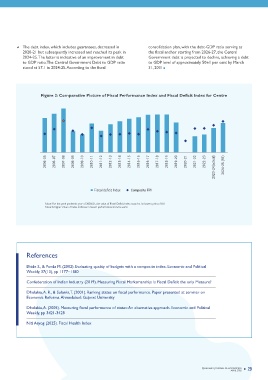
2006-07 69.2 42.7 0.0 88.3 87.0 30.9 53.0 Figure 2: Comparative Picture of Fiscal Performance Index and Fiscal Deficit Index for Centre
2007-08 100.0 44.0 44.2 100.0 100.0 44.6 72.1
2008-09 54.5 92.4 3.3 48.0 44.8 53.1 49.3
2009-10 14.4 97.9 7.5 40.8 33.1 51.1 40.8
2010-11 27.7 86.8 22.0 65.9 65.0 67.2 55.8
2011-12 22.2 58.7 12.3 49.1 44.6 37.2 37.4
2012-13 34.4 29.5 8.5 63.9 58.2 49.6 40.7
2013-14 24.9 23.1 8.4 70.8 66.0 53.7 41.1
2014-15 24.1 17.1 5.9 76.5 69.9 66.5 43.3
2015-16 5.0 0.0 24.3 80.0 77.0 62.6 41.5
2016-17 19.7 12.3 26.0 85.6 83.9 88.0 52.6 2005-06 2006-07 2007-08 2008-09 2009-10 2010-11 2011-12 2012-13 2013-14 2014-15 2015-16 2016-17 2017-18 2018-19 2019-20 2020-21 2021-22 2022-23 2024-25 (RE)
2017-18 25.2 22.7 10.8 86.2 74.8 70.1 48.3 2023-24(actual)
2018-19 10.7 15.1 17.0 86.5 78.3 70.7 46.4
2019-20 0.0 58.6 16.6 68.3 63.7 57.2 44.1
2020-21 21.0 100.0 36.0 0.0 0.0 0.0 26.2 Fiscal deficit Index Composite FPI
2021-22 43.5 91.0 61.0 36.9 46.9 45.8 54.2
2022-23 50.9 57.5 77.1 40.8 53.2 49.3 54.8 Note: For the peak pandemic year of 2020-21, the value of Fiscal Deficit Index stood at its lowest print of 0.0
2023-24 47.3 30.0 100.0 55.4 76.2 61.3 61.7 Note: A higher value of Index indicates a better performance and vice versa
(actual)
2024-25 (RE) 47.2 25.1 97.6 66.8 87.4 100.0 70.7
Note: A higher value of Index indicates a better performance and vice versa, RE is revised estimates
Following are the key highlights of the index The net tax revenue index has remained steady at around
components at the Centre as depicted in Table 1 47.0 level for the last two years after hitting its lowest References
value in 2019-20. Gross tax revenues contracted by 3.4 per
The strategy of the government to stimulate growth by cent year-on-year in this year, due to changes such as the Bhide S., & Panda M. (2002). Evaluating quality of budgets with a composite index. Economic and Political
increasing its capital spending led to the capital reduction in corporate tax rate and MAT rate, as well as an Weekly, 37(13), pp 1177–1180
expenditure index hitting its highest ever value in 2023-24 increase in refunds issued during the year. The value of the
after seeing a sustained rise since 2021-22. This is indeed a index recovered thereafter in line with improvement seen Confederation of Indian Industry (2019). Measuring Fiscal Marksmanship: Is Fiscal Deficit the only Measure?
good sign as capital spending has a significant multiplier in tax buoyancy.
impact on the productive sectors of the economy. Hence, it Dholakia, A. R., & Solanki, T. (2001). Ranking states on fiscal performance. Paper presented at seminar on
comes as no surprise that the real GDP stood at a high of In 2020-21, the fiscal and revenue deficit to GDP ratios Economic Reforms. Ahmedabad: Gujarat University
9.2 per cent in 2023-24, staging a sharp rebound from 7.6 reached their lowest levels due to the government's fiscal
per cent in the previous year. stimulus which saw the fiscal deficit ratio rising to a high of Dholakia, A. (2005). Measuring fiscal performance of states: An alternative approach. Economic and Political
9.2 per cent of GDP. However, these indices improved Weekly, pp 3421-3428
During the peak pandemic year of 2020-21, the index of significantly in subsequent years as the central government
revenue expenditure hit a high as the central government began adhering to a path of fiscal discipline. The fiscal Niti Aayog (2025). Fiscal Health Index
stepped up its spending efforts to spur economic growth. It deficit ratio fell below the psychological threshold of 5 per
continued to remain high in the subsequent year too, cent in 2024-25, and it is projected to further decrease to
however, thereafter the index continued to moderate, and 4.4 per cent of GDP in the current year as the government
it hit a low in 2024-25. intensifies its efforts towards fiscal consolidation.
28 QUARTERLY JOURNAL OF ECONOMICS QUARTERLY JOURNAL OF ECONOMICS 29
APRIL 2025
APRIL 2025