
Page 53 - CII ARTHA_Next Generation_Web
P. 53
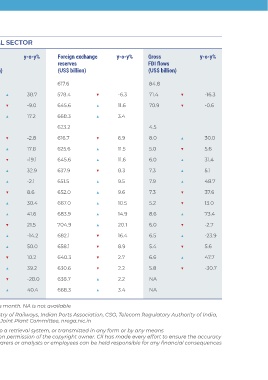
EXTERNAL SECTOR


 Merchandise  y-o-y%  Merchandise  y-o-y%  Trade  y-o-y%  Foreign exchange  y-o-y%  Gross  y-o-y%
 exports  imports  Deficit  reserves                                FDI flows
 (US$ billion)  (US$ billion)  (US$ billion)  (US$ billion)        (US$ billion)


 FY22  422.0  613.0  191.0  617.6                                  84.8

 FY23    451.1   ▲  6.8  716.0  ▲  16.8  264.9  ▲  38.7  578.4  ▼  -6.3  71.4    ▼          -16.3

 FY24  437.1  ▼  -3.1  678.2  ▼  -5.3  241.1  ▼  -9.0  645.6  ▲  11.6  70.9      ▼          -0.6

 FY25  437.6  ▲  0.1  720.2  ▲  6.2  282.6  ▲  17.2  668.3  ▲  3.4

 Dec-23  38.4  57.15  18.8  623.2                                  4.5

 Jan-24  37.3  ▼  4.3  53.88  ▼  2.0  16.6  ▼  -2.8  616.7  ▼  6.9  8.0          ▲          30.0

 Feb-24  41.4  ▲  11.9  60.92  ▲  13.7  19.5  ▲  17.8  625.6  ▲  11.5  5.0       ▼          5.6

 Mar-24  41.7  ▲  -0.6  57.03  ▼  -6.4  15.3  ▼  -19.1  645.6  ▲  11.6  6.0      ▲          31.4

 Apr-24  35.3  ▼  2.0  54.49  ▼  11.1  19.2  ▲  32.9  637.9  ▼  8.3  7.3         ▲          5.1

 May-24  39.6  ▲  13.3  61.63  ▲  7.2  22.0  ▲  -2.1  651.5  ▲  9.5  7.9         ▲          48.7

 Jun-24  35.2  ▼  2.4  55.99  ▼  4.6  20.8  ▼  8.6  652.0  ▲  9.6  7.3           ▼          37.6

 Jul-24  34.7  ▼  0.6  59.48  ▲  11.2  24.8  ▲  30.4  667.0  ▲  10.5  5.2        ▼          13.0

 Aug-24  34.5  ▼  -9.9  68.51  ▲  10.0  34.0  ▲  41.6  683.9  ▲  14.9  8.6       ▲          73.4

 Sep-24  34.3  ▼  -0.2  58.72  ▼  7.8  24.4  ▼  21.5  704.9  ▲  20.1  6.0        ▼          -2.7

 Oct-24  39.0  ▲  16.6  65.07  ▲  1.9  26.1  ▲  -14.2  682.1  ▼  16.4  6.5       ▲          -23.9

 Nov-24  32.0  ▼  -5.3  63.93  ▼  16.1  32.0  ▲  50.0  658.1  ▼  8.9  5.4        ▼          5.6

 Dec-24  37.8  ▲  -1.5  58.48  ▼  2.3  20.7  ▼  10.2  640.3  ▼  2.7  6.6         ▲          47.7

 Jan-25  36.4  ▼  -2.5  59.43  ▲  10.3  23.0  ▲  39.2  630.6  ▼  2.2  5.8        ▼          -30.7

 Feb-25  36.9  ▲  -10.9  50.96  ▼  -16.3  14.1  ▼  -28.0  638.7  ▲  2.2  NA

 Mar-25  42.0  ▲  0.7  63.51  ▲  11.4  21.5  ▲  40.4  668.3  ▲  3.4  NA


 The movement in arrows denotes the improvement/deterioration vis-à-vis the previous month. NA is not available
 Sources: RBI, CMIE, SIAM, TMA, Ministry of Commerce, Airports Authority of India, Ministry of Railways, Indian Ports Association, CSO, Telecom Regulatory Authority of India,
 ICEMA, PIB, Petroleum Planning & Analysis Cell, POSOCO, EPFO, Labour Bureau, CGA, Joint Plant Committee, nrega.nic.in
 Disclaimer: No part of this publication may be reproduced, stored in, or introduced into a retrieval system, or transmitted in any form or by any means
 (electronic, mechanical, photocopying, recording or otherwise), without the prior written permission of the copyright owner. CII has made every effort to ensure the accuracy
 of information presented in this document. However, neither CII nor any of its office bearers or analysts or employees can be held responsible for any financial consequences
 arising out of the use of information provided herein.


 46  QUARTERLY JOURNAL OF ECONOMICS
 APRIL 2025