
Page 50 - CII ARTHA_Next Generation_Web
P. 50
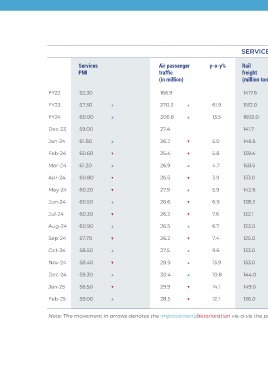
SERVICE SECTOR


                                    Services                            Air passenger         y-o-y%         Rail                 y-o-y%          Port                     y-o-y%         Number of mobile       y-o-y%
                                    PMI                                 traffic                               freight                              Cargo traffic                            subscribers
                                                                        (in million)                         (million ton)                        (million ton)                           (in million)


                       FY22         52.30                               166.9                                1417.6                               720.3                                   1166.9

                       FY23         57.30         ▲                     270.3       ▲          61.9          1512.0        ▲        6.6           768.0            ▲         6.6          1032.1        ▼          -11.6

                       FY24         60.00         ▲                     306.8       ▲          13.5          1602.0        ▲        5.9           802.1            ▲         4.4          886.7         ▼          -14.1


                       Dec-23       59.00                               27.4                                 141.7                                69.9                                    904.5

                       Jan-24       61.80         ▲                     26.2        ▼          5.0           146.5         ▲        9.3           72.5             ▲         3.4          911.0         ▲          8.6


                       Feb-24       60.60         ▼                     25.4        ▼          5.8           139.4         ▼        12.4          66.9             ▼         2.1          916.8         ▲          9.2

                       Mar-24       61.20         ▲                     26.9        ▲          4.7           158.5         ▲        9.6           73.9             ▲         2.7          924.0         ▲          9.2

                       Apr-24       60.80         ▼                     26.5        ▼          3.9           133.0         ▼        5.2           67.3             ▼         34.7         928.4         ▲          9.1


                       May-24       60.20         ▼                     27.9        ▲          5.9           142.6         ▲        6.3           72.0             ▲         5.9          935.1         ▲          9.1

                       Jun-24       60.50         ▲                     26.6        ▼          6.9           138.3         ▼        12.4          69.1             ▼         4.3          940.7         ▲          9.2

                       Jul-24       60.30         ▼                     26.2        ▼          7.6           132.1         ▼        6.6           70.1             ▲         5.8          946.1         ▲          9.0


                       Aug-24       60.90         ▲                     26.5        ▲          6.7           123.0         ▼        -3.1          69.6             ▼         6.7          949.2         ▲          8.3

                       Sep-24       57.70         ▼                     26.2        ▼          7.4           125.0         ▲        1.2           65.6             ▼         5.9          944.4         ▼          6.7

                       Oct-24       58.50         ▲                     27.5        ▲          9.6           133.0         ▲        3.1           68.2             ▲         -3.2         941.5         ▼          6.0


                       Nov-24       58.40         ▼                     28.9        ▲          13.9          133.0         _        3.6           67.5             ▼         -4.8         944.7         ▲          5.4

                       Dec-24       59.30         ▲                     30.4        ▲          10.8          144.0         ▲        1.6           72.1             ▲         3.1          945.0         ▲          4.5

                       Jan-25       56.50         ▼                     29.9        ▼          14.1          149.0         ▲        1.7           77.0             ▲         6.2          NA


                       Feb-25       59.00         ▲                     28.5        ▼          12.1          136.0         ▼        -2.4          71.2             ▼         6.6          NA


                       Note: The movement in arrows denotes the improvement/deterioration vis-à-vis the previous month. NA is not available


                                                                                                                                                                                                      QUARTERLY JOURNAL OF ECONOMICS  45
                                                                                                                                                                                                                        APRIL 2025