
Page 22 - CII ARTHA_Next Generation_Web
P. 22
While Garlic and Ginger exhibit extreme price movements, and fragmented production cycles. Onion prices, though, food commodities, including cereals, meat, eggs, fruits,
their overall impact on inflation is relatively moderate due to exhibit a distinct seasonal pattern, but are prone to periodic ERRATIC UNUSUAL WEATHER HAS vegetables, pulses, sugar, spices and prepared meals. The own
lower weights in the CPI, whereas, the TOP commodities volatility and inflationary shocks. Potato prices follow a SIGNIFICANTLY CONTRIBUTED TO and directional spillovers of core and food commodities are
(Tomato, Onion, Potato) exert greater influence on inflation well-defined seasonal pattern, determined primarily by the SUPPLY-SIDE SHOCKS presented in Figure 6 .
2
due to their higher weights in the vegetable basket. crop’s production cycle and market arrivals. While relative
storability of potatoes provides a degree of price stability, Supply shocks caused by unusual weather have been the The relatively high own spillover index for core commodities
‘TOP’ COMMODITIES EXPERIENCE SHARP inadequate storage infrastructure and erratic weather patterns primary driver of higher food inflation over the past three (70.2 per cent) suggests that inflation in this category is
contribute to its seasonal price volatility.
SEASONAL PRICE SWINGS LEADING TO years. According to the Economic Survey 2024-25, India ranks primarily driven by internal dynamics rather than food inflation
shocks. This has an important policy implication for the RBI
RECURRENT INFLATIONARY PRESSURES Overall, seasonality in TOP commodities leads to recurrent as the seventh most vulnerable country to climate change. The when it decides on the movement of interest rates. The
inflationary pressures which are not only a consequence of frequency of heatwaves in India has risen over the past three analysis clearly shows given the low spillover across food and
supply and demand imbalances arising from production cycles years, with an average of 18 per cent of days experiencing core inflation (regarded as the proxy for demand-side
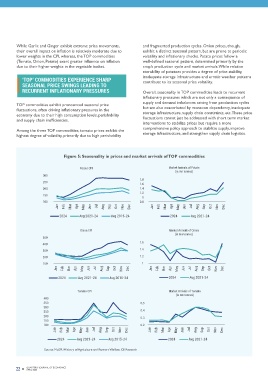
TOP commodities exhibit pronounced seasonal price heatwaves during 2022-2024, compared to just 5 per cent of
fluctuations, often driving inflationary pressures in the but are also exacerbated by monsoon dependency, inadequate days in 2020 and 2021. In addition to heatwaves, the uneven pressures in the economy), high food prices should not be a
economy due to their high consumption levels, perishability storage infrastructure, supply chain constraints, etc. These price distribution of monsoon rainfall has significantly contributed to deterrent to the Central Bank to cut interest rates in a bid to
and supply chain inefficiencies. fluctuations cannot just be addressed with short term market reduced crop yields, thereby affecting food production and support moderating growth.
interventions to stabilize prices but require a more
comprehensive policy approach to stabilize supply, improve exacerbating food inflation. Within food commodities, vegetables exhibit a strong degree
Among the three TOP commodities, tomato prices exhibit the
highest degree of volatility, primarily due to high perishability storage infrastructure, and strengthen supply chain logistics. of internal interconnectedness, with an own spillover index of
Heatwaves in India have increased 89.7 per cent. This implies that vegetable prices are largely
in the last three years influenced by their own supply and demand conditions rather
75 76 than core or food price shocks. The spillover contribution
Figure 5: Seasonality in prices and market arrivals of TOP commodities from other core and food commodities to vegetables stands at
10.3 per cent, while the spillover contribution to others is 27.0
per cent, indicating that vegetables are net transmitters of
Potato CPI Market Arrivals of Potato shocks rather than recipients.
(in mn tonnes) 42
300
1.8 23 These results suggest that vegetable price movements are
250
1.6 predominantly influenced by their supply-side dynamics rather
200 1.4 12 than overall inflationary trends. This reinforces the argument
1.2
150 that food inflation control measures must address supply-side
1 2020 2021 2022 2023 2024
100 0.8 Source: IMD and Ministry of Earth Sciences constraints within vegetables rather than relying on general
Jan Feb Mar Apr May Jun Jul Aug Sep Oct Nov Dec Jan Feb Mar Apr May Jun Jul Aug Sep Oct Nov Dec inflation targeting measures.
2024 Avg 2021-24 Avg 2015-24 2024 Avg 2021-24
VEGETABLE PRICES ARE PRIMARILY DRIVEN Figure 6: Spillovers among Core and
BY SUPPLY-SIDE DYNAMICS RATHER THAN Food Commodities (per cent)
Onion CPI Market Arrivals of Onion OVERALL INFLATIONARY TRENDS 180.0
(in mn tonnes) 160.0
500
1.6 140.0
400 To further understand the price dynamics of agricultural
300 1.4 commodities, particularly the highly volatile TOP commodities, 120.0
1
200 1.2 the Diebold and Yilmaz (DY) Spillover Index 100.0
methodology is employed. This methodology is based on
100 1 Vector-autoregressive (VAR) framework that quantifies the 80.0
Jan Feb Mar Apr May Jun Jul Aug Sep Oct Nov Dec Jan Feb Mar Apr May Jun Jul Aug Sep Oct Nov Dec extent to which shock in one commodity transmits to others, 60.0 Own
spillovers
2024 Avg 2021-24 Avg 2015-24 2024 Avg 2021-24 thereby providing valuable insights into the interdependencies 40.0 Contribution
within agricultural commodities. The analysis categorizes 20.0 from Others
interconnectedness or spillovers into own spillovers and 0.0 Contribution
Tomato CPI Market Arrivals of Tomato directional spillovers (contribution from others and Egg to Others
(in mn tonnes) contribution to others). Core Index Cereals Meat Fruits Pulses Sugar Spices Meals
400 Vegetables
350 0.5
300 Using monthly inflation data from January 2012 to December Source: CII Research
250 0.4 2024, the DY spillover index is computed across core CPI and
200 0.3
150
100 0.2
Jan Feb Mar Apr May Jun Jul Aug Sep Oct Nov Dec Jan Feb Mar Apr May Jun Jul Aug Sep Oct Nov Dec
2024 Avg 2021-24 Avg 2015-24 2024 Avg 2021-24 1 The DY spillover index is calculated based on the forecast error variance decomposition of a VAR model. It decomposes the total forecast error variance into components attributable
to own and cross-variable shocks, i.e., the contribution of each variable’s own shocks (own variance share) and the shocks received from or transmitted to other commodities (cross
variance share), respectively. The total spillover index represents the proportion of forecast error variance attributable to cross-market interactions, providing a measure of overall
Source: MoSPI, Ministry of Agriculture and Farmers Welfare, CII Research market interconnectedness.
2 Detailed results are not presented due to brevity of space but are available on request.
22 QUARTERLY JOURNAL OF ECONOMICS QUARTERLY JOURNAL OF ECONOMICS 23
APRIL 2025
APRIL 2025