
Page 21 - CII ARTHA_Next Generation_Web
P. 21
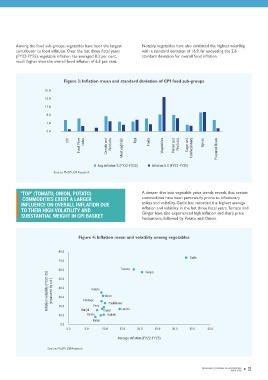
In 2024-25, food inflation remained stubbornly high at 7.3 per   Among the food sub-groups, vegetables have been the largest   Notably, vegetables have also exhibited the highest volatility,
 CONTRIBUTION OF FOOD INFLATION TO   cent even though it was marginally lower than the 7.5 per cent   contributor to food inflation. Over the last three fiscal years   with a standard deviation of 16.9, far exceeding the 2.6
 THE HEADLINE PRINT HAS MORE THAN   in the previous fiscal year. The stickiness in food inflation has   (FY22-FY25), vegetable inflation has averaged 8.3 per cent,   standard deviation for overall food inflation.
 DOUBLED IN THE RECENT YEARS  kept headline inflation at 4.6 per cent, even as core inflation   much higher than the overall food inflation of 6.3 per cent.
 moderated sharply to 3.5 per cent from 4.3 per cent in the
 previous year. Historically as well, food inflation has not only
 Rising food prices not only erode households’ purchasing   been higher, but a volatile component of headline inflation
 power and worsen economic inequality but also undermine   compared to core inflation. Over the last decade (FY16-FY25),   Figure 3: Inflation mean and standard deviation of CPI food sub-groups
 broader economic stability by dampening overall consumption.   food inflation averaged 5.1 per cent, outpacing headline
 Addressing food inflation is, therefore, not only essential for   inflation at 5.0 per cent and core inflation at 4.9 per cent. The   20.0
 maintaining price stability but also crucial for ensuring food   volatility of food inflation, measured by standard deviation of
 security and fostering sustainable economic growth.  3.6, significantly exceeded that of headline inflation (1.4) and   16.0
 core inflation (0.9).  12.0
                      8.0

                      4.0
 Figure 1: Headline, core and food inflation (y-o-y%)
 20.0
                      0.0
                                     Food Price  Cereals and  Products  Meat and Fish  Vegetables  Pulses and  Products  Sugar and  Confectionary  Prepared Meals
                               CPI                           Egg
 15.0                                 Index                        Fruits                   Spices

 10.0
                                            Avg Inflation % (FY22-FY25)  Inflation S.D.(FY22-FY25)
 5.0                     Source: MoSPI, CII Research


 0.0
 Apr-12  Mar-13  Feb-14  Jan-15  Dec-15  Nov-16  Oct-17  Sep-18  Aug-19  Jul-20  Jun-21  May-22  Apr-23  Mar-24  Feb-25  'TOP' (TOMATO, ONION, POTATO)  A deeper dive into vegetable price trends reveals that certain
                                                                commodities have been particularly prone to inflationary
 -5.0      COMMODITIES EXERT A LARGER                           spikes and volatility. Garlic has recorded the highest average
 CPI  Core Index  Food Price Index  INFLUENCE ON OVERALL INFLATION DUE   inflation and volatility in the last three fiscal years. Tomato and
 Source: MoSPI  TO THEIR HIGH VOLATILITY AND                    Ginger have also experienced high inflation and sharp price
          SUBSTANTIAL WEIGHT IN CPI BASKET                      fluctuations, followed by Potato and Onion.

 In recent years, there has been an increasing influence of food   the pre-covid average (FY16-FY20) of 30.6 per cent. In
 inflation on the overall inflation dynamics. The relative   contrast, core inflation’s contribution to headline inflation has
 contribution of food inflation to headline inflation has more   moderated from a pre-covid average of 55.2 per cent to 36.1   Figure 4: Inflation mean and volatility among vegetables
 than doubled since 2021-22, increasing from 26.9 per cent in   per cent in 2024-25.
 2021-22 to 61.7 per cent in 2024-25. This is much higher than
                           80.0
 Figure 2: Relative contribution to headline inflation (%)  70.0                     Garlic
 70.0
 61.7                      60.0                        Tomato
 60.0  55.2  54.5                                                 Ginger
 51.3                      50.0
 50.0
 43.0
 38.9  38.3                40.0
 40.0  36.1           Inflation volatility (FY22-25)  (measured by s.d.)  Potato
 30.6                                           Onion
 30.0  26.9                30.0       Cabbage
                                                 Cauliflower
 20.0                      20.0      Brinjal  Peas  Carrot  Lemon
 10.0                      10.0         Beans    Radish
                                          Palak
 0.0                        0.0
 Avg  2021-22  2022-23  2023-24  2024-25
 (2015-20)                     0.0     5.0    10.0    15.0    20.0    25.0   30.0    35.0    40.0
 Core Inflation  Food Inflation
                                                     Average Inflation (FY22-FY25)
 Note: The relative contribution of food and core inflation to headline inflation is determined by their respective weights in CPI. Core CPI has a weight of 47.3 per cent, and the food price index has a
 weight at 39.06 per cent in CPI. The remaining share is attributed to non-alcoholic beverages, prepared meals and snacks, and fuel and light.
                      Source: MoSPI, CII Research
 Source: MoSPI, CII Research


 20  QUARTERLY JOURNAL OF ECONOMICS                                                        QUARTERLY JOURNAL OF ECONOMICS  21
 APRIL 2025
                                                                                                        APRIL 2025